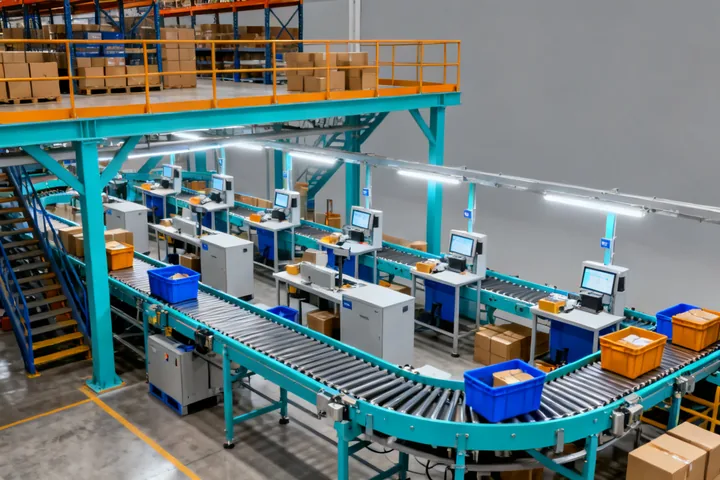
E-commerce fulfillment
Short cutoffs and deep SKU catalogs stress induction balance, recirculation and WCS wave release. Peak factor must include backlog drain after promotional spikes, not only the design-rate slide.

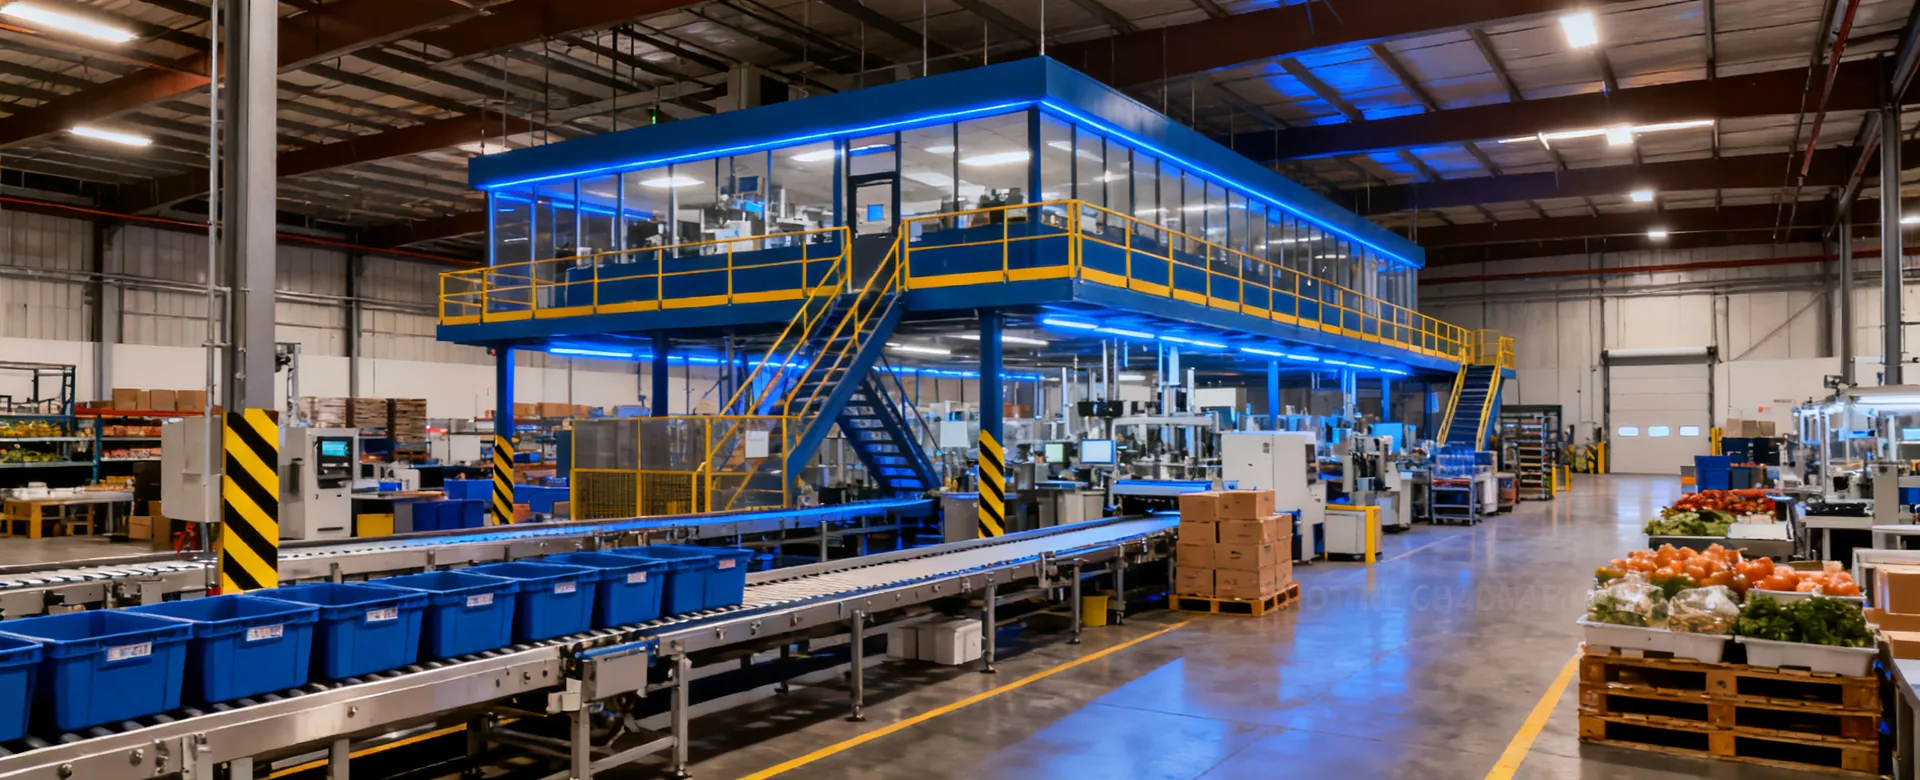
Vertical labels alone do not size buffers or interface timeouts. FORTNA starts each industry conversation with the operating profile that changes WMS, WCS and WES behavior under pressure.
Each card highlights the constraints that most often rewrite release logic, divert confirmation and cutover sequencing.
Short cutoffs and deep SKU catalogs stress induction balance, recirculation and WCS wave release. Peak factor must include backlog drain after promotional spikes, not only the design-rate slide.
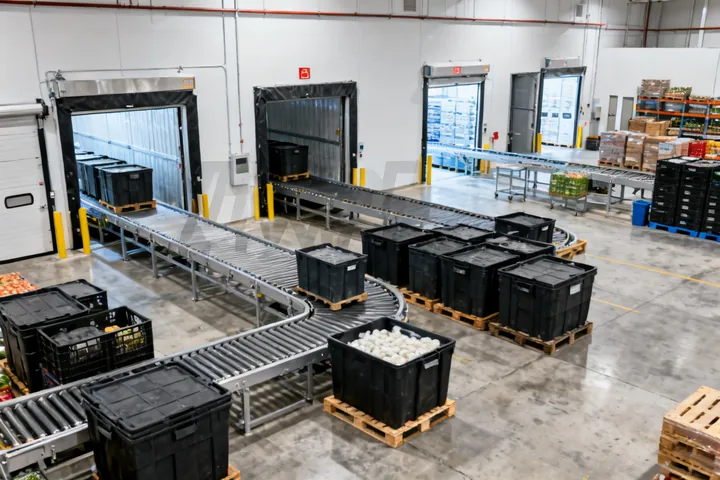
Store-order sequencing, mixed temperature zones and late substitutions change buffer sizing. Exception routing must name who owns holds when a cold-chain sensor or ASN fails mid-wave.
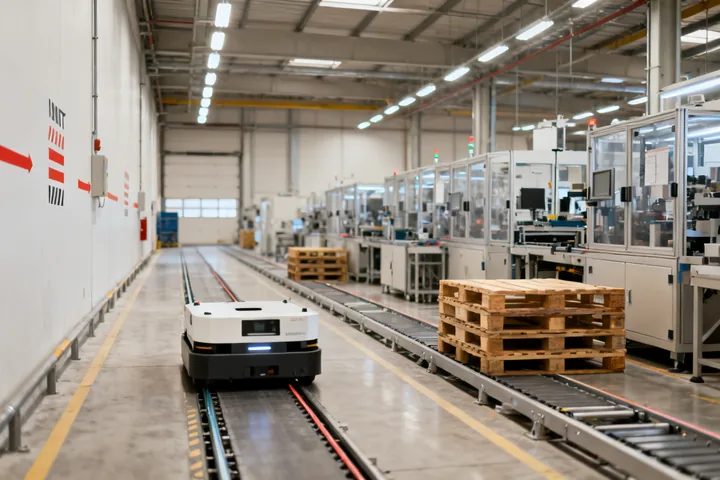
Line-side deliveries need takt alignment, load identity and a defined response when a workcell cannot receive material. PLC and WCS timeouts become production risk if left implicit.

Traceability and controlled access must stay attached to physical handoffs. Quarantine locations, recovery records and host confirmation states are part of the control design, not paperwork afterthoughts.
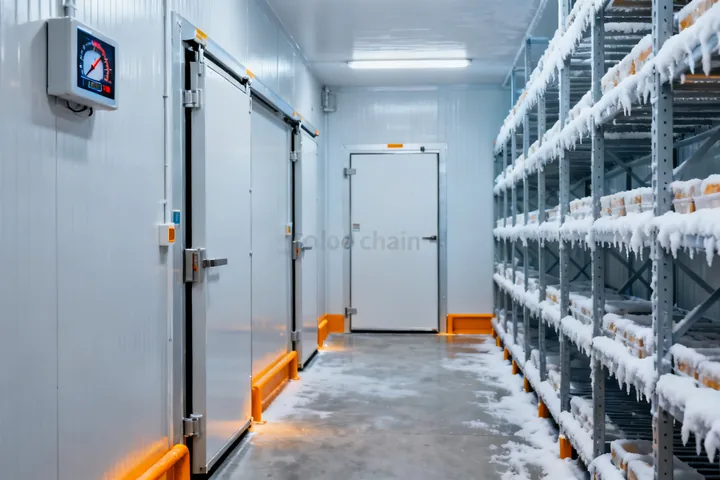
Sensor behavior, maintenance access and duty cycles are reviewed at the stated temperature band. Recovery paths for door open-time and equipment warm-up must be labeled before rate claims.
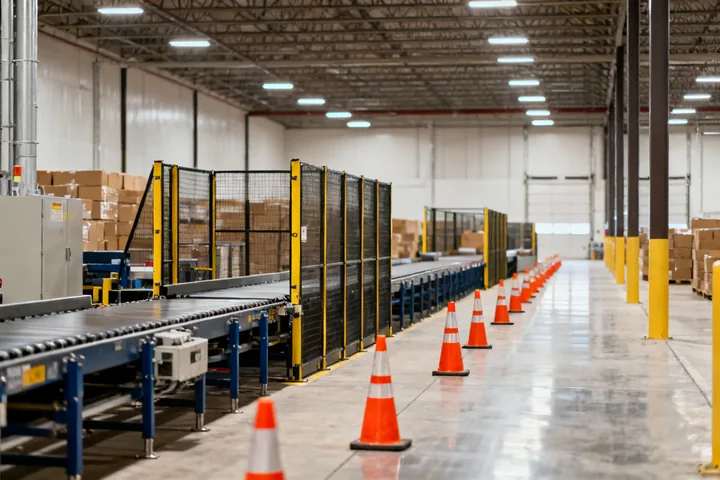
Shared docks, legacy conveyors and phased cutover windows define which automation layers can go live first. FORTNA treats fallback states as acceptance criteria, not optional appendices.
These are not slogans. They are opposing operating preferences that change WMS, WCS and WES architecture, buffer sizing and cutover sequencing.
Centralized view: One orchestration layer can optimize divert confirmation, merge logic and wave release across the network, with a single operational picture for alarms.
Modular view: Zone controllers and fleet managers isolate failures and reduce single-vendor dependency, but require a clearer responsibility matrix for timeouts and retries across OPC UA or proprietary handshakes.
FORTNA documents interface cycle-time targets in seconds for PLC/WCS confirmations, including exception timeouts, before recommending either path.
Peak-first view: Design rate and peak order lines per hour maximize output under defined SKU mix and window length.
Resilience-first view: Accumulation, recirculation, spare capacity and graceful degradation keep stable flow when ASN quality fails or a subsystem cannot confirm.
Throughput claims without replenishment, buffer occupancy and exception recovery assumptions are treated as incomplete. System availability should be discussed at subsystem and end-to-end levels, not only as a single percentage slide.
Fixed automation: Deterministic conveyors, sortation and AS/RS deliver mature capacity for stable profiles.
Flexible robotics: AMR fleets and modular workstations phase faster under volatile demand, but need explicit traffic rules, charging windows and fleet-management ownership.
Greenfield: Layout, power and fire zones can be sized with the control architecture.
Brownfield: Shared docks, legacy conveyors and live outbound waves force staged cutover, fallback states and commissioning windows that protect daily fulfillment.
Figures describe evaluation structure used in FORTNA workshops. They are not independently verified public performance claims.
Tell us which SKU bands, temperature zones or host interfaces already constrain the design. We will map the next questions without forcing a one-size automation story.